14. Text: Worksheets
Text Recap of the Previous Video
Sheet interface
Alright! Now that you have your data loaded, time to make a graph. Click on “Sheet1” in the bottom bar. First I'll introduce you to the sheet interface.
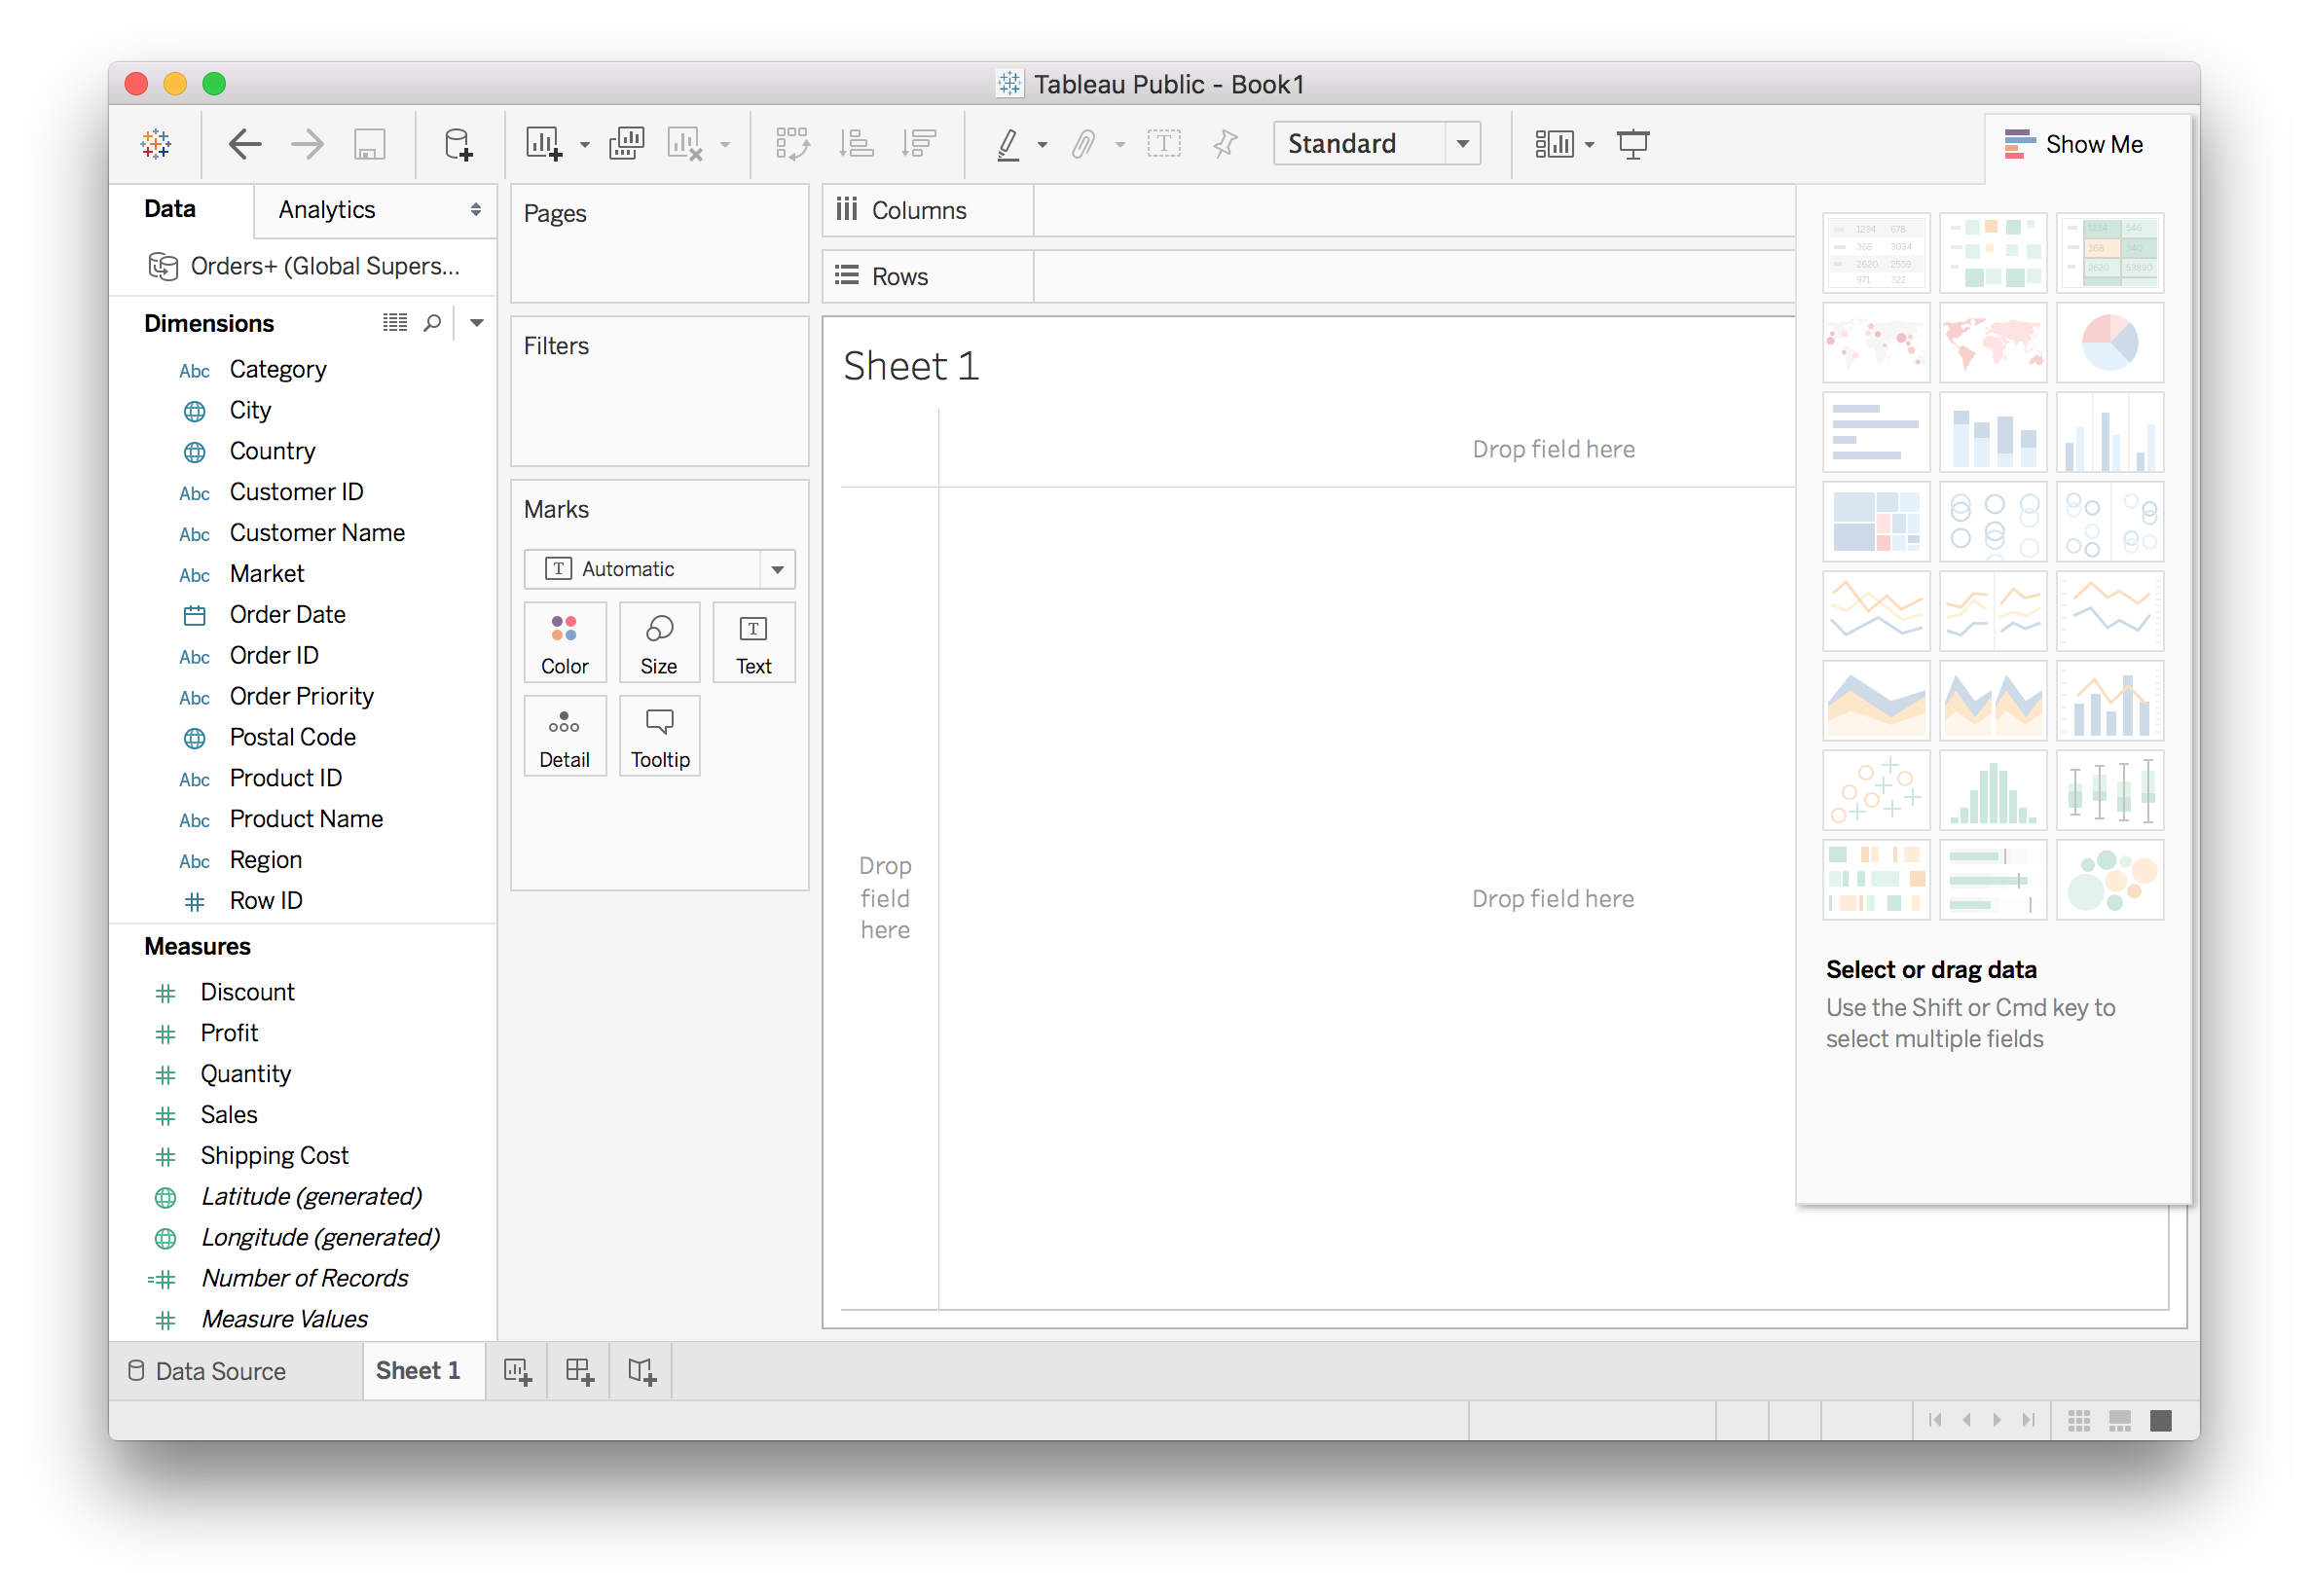
On the left you’ll see your data columns (also called "fields"), split between dimensions and measures. Categorical, qualitative, and time data are listed as dimensions. Quantitative numerical data is listed as measure. Tableau automatically detects the data type in each column and splits them up accordingly.
You'll notice the dimensions are colored blue and the measures are green. This is the same color coding you've seen before, blue for discrete data and green for continuous data. Remember that discrete data can only be certain values like integers or categories, while continuous data can be any value.
Dimensions aren't required to be discrete and measures aren't required to be continuous. You can convert discrete data to continuous in some cases, such as with time. Right click the field, or click the little triangle to bring up the menu. You can’t do this with categorical data because it can’t be continuous. You can also convert continuous data to discrete.
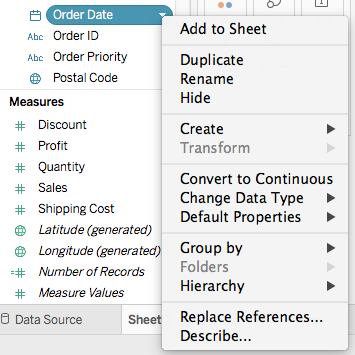
Tableau automatically aggregates measures, but not dimensions. That is, it does calculations like sums and means. Dimensions are used to group the data and set the level of granularity. You’ll learn about aggregation and granularity next, so don’t worry if you don't know what these mean yet.
Making your first plot
You can select the data you want to plot by dragging the fields to the columns or rows shelves (see below). When you drag a discrete field to Columns, it creates a discrete axis. When you use a continuous field, it creates a continuous axis. You can also drag the fields directly onto the sheet.
To start with, you can look at the number of records for each market. Drag the Market field to the Columns shelf.
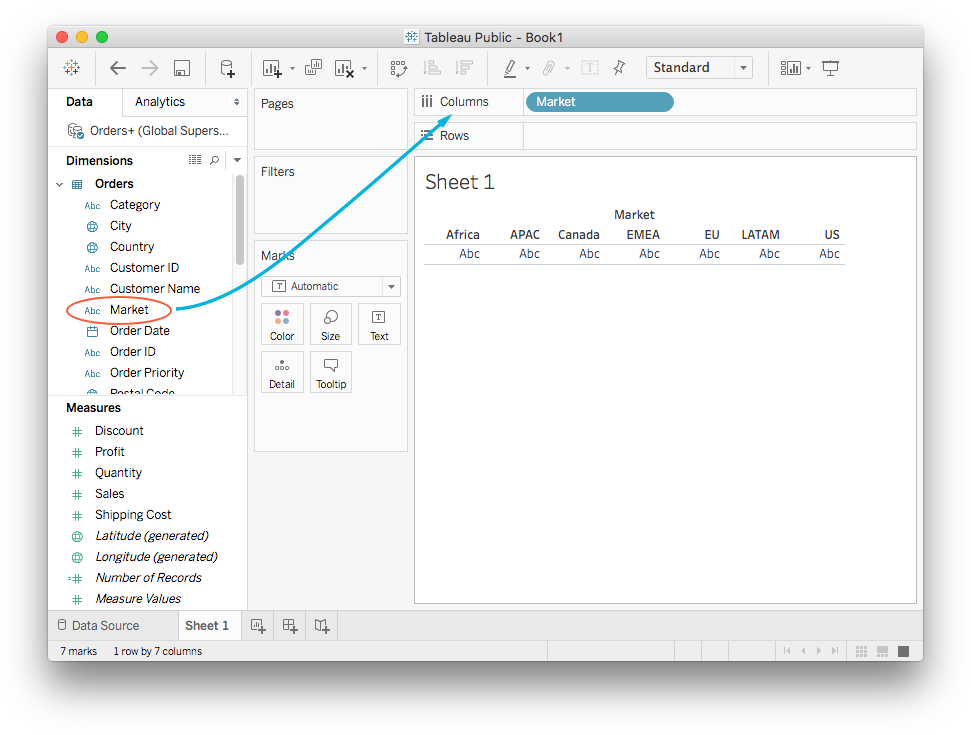
You can see the axis in the sheet panel showing labels for each market. Now drag Number of Records from the measures to the rows shelf.
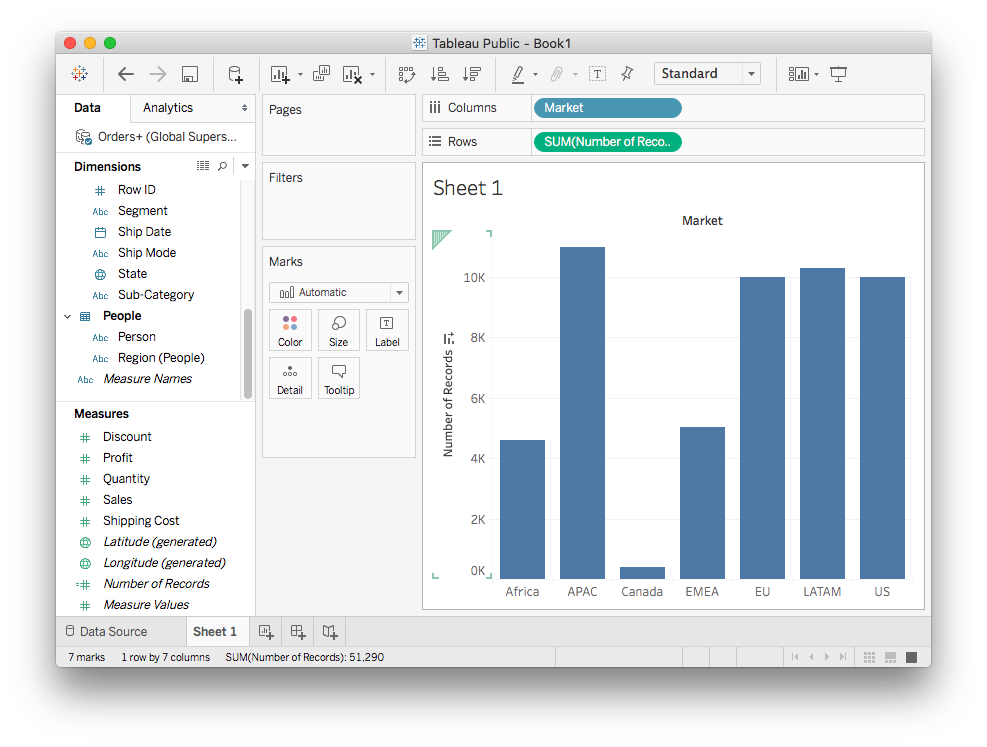
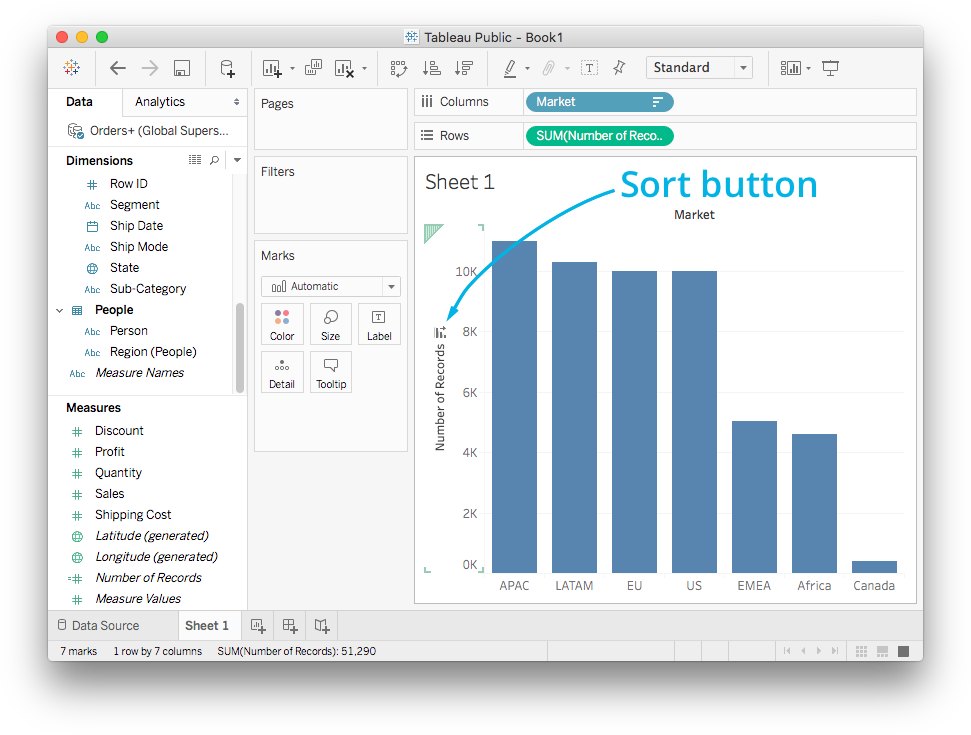
You'll see in the rows shelf the Number of Records field turned into a little pill that says SUM(Number of Records). This is called an aggregation, it is aggregating the data for each market and summing the values. You can hover over the bars to see the exact sum for each market. (Try this yourself!)
In general, this is how you will make most of your plots, dragging dimension and measure fields to the shelves. You can also remove fields from the plot by dragging the pills off the shelves.
From here you can also sort the bars by clicking on the sort icon on the axis.
Finally, as you can see above, there are tabs at the bottom to create new sheets, dashboards, and stories.
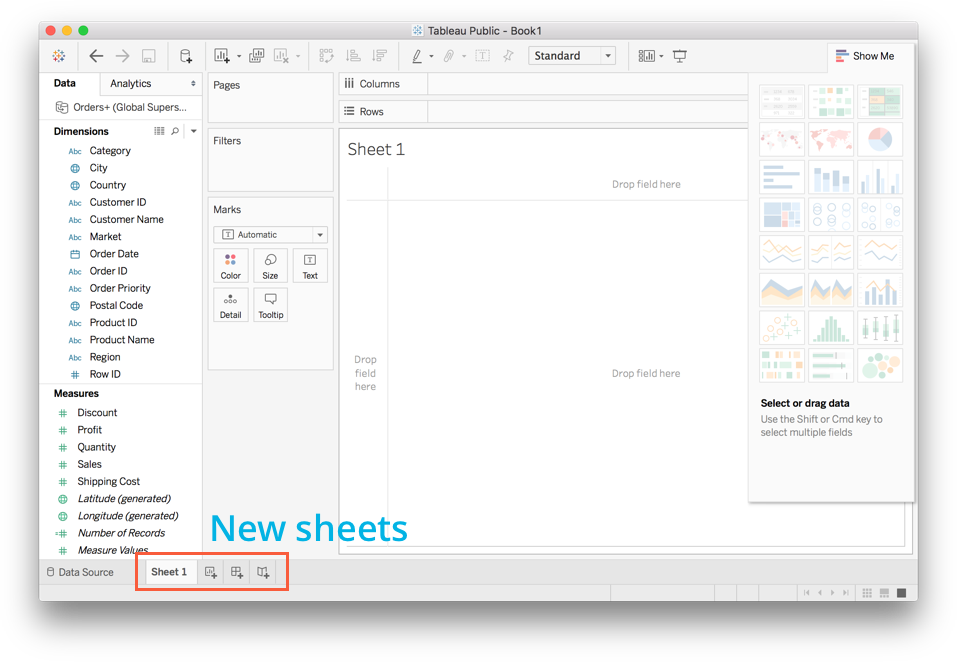
Note: If you are using Tableau version 2020, you will notice that the Number of records field is not automatically calculated.
To find the Number of records follow the instructions below:
- Click on a small drop-down arrow at the top left corner just above the tables (dimensions) and select "Create Calculated Field". See the screenshot below.
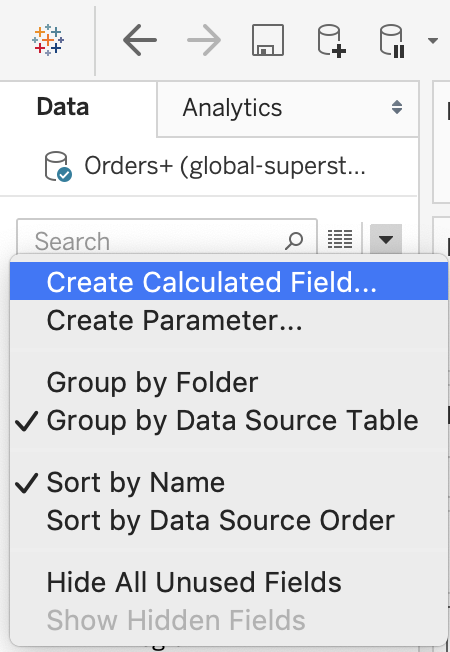
- This will open a small window where you write formulas to perform calculations on data.
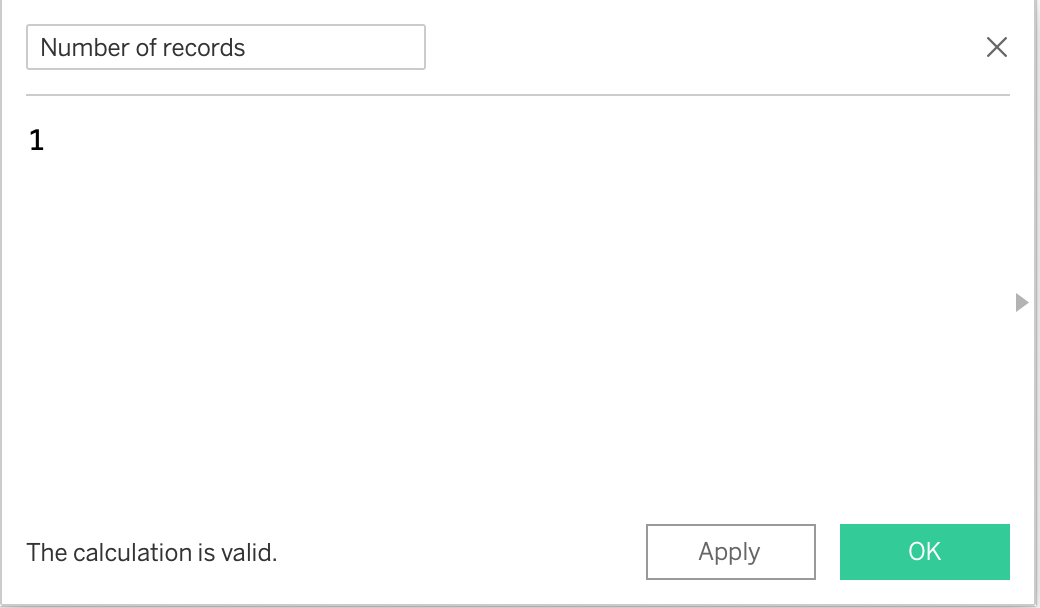
- Change the calculation name to Number of records (or you could write any name you want to) just as shown in the above image, then enter 1 in the field below and click on "OK"
This will create a calculated field with the name "Number of records" in the measures pane.
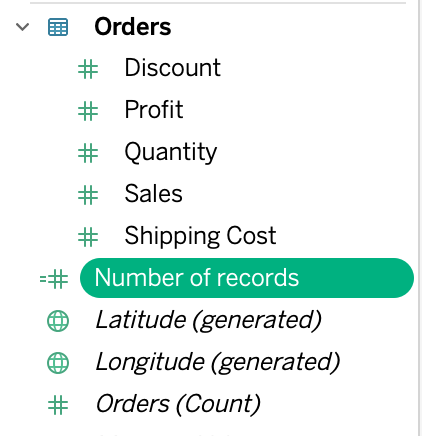
=# sign signifies that the record is a "Calculated Field"
Now drag this calculated field to rows and market to columns, you will then get the desired output.
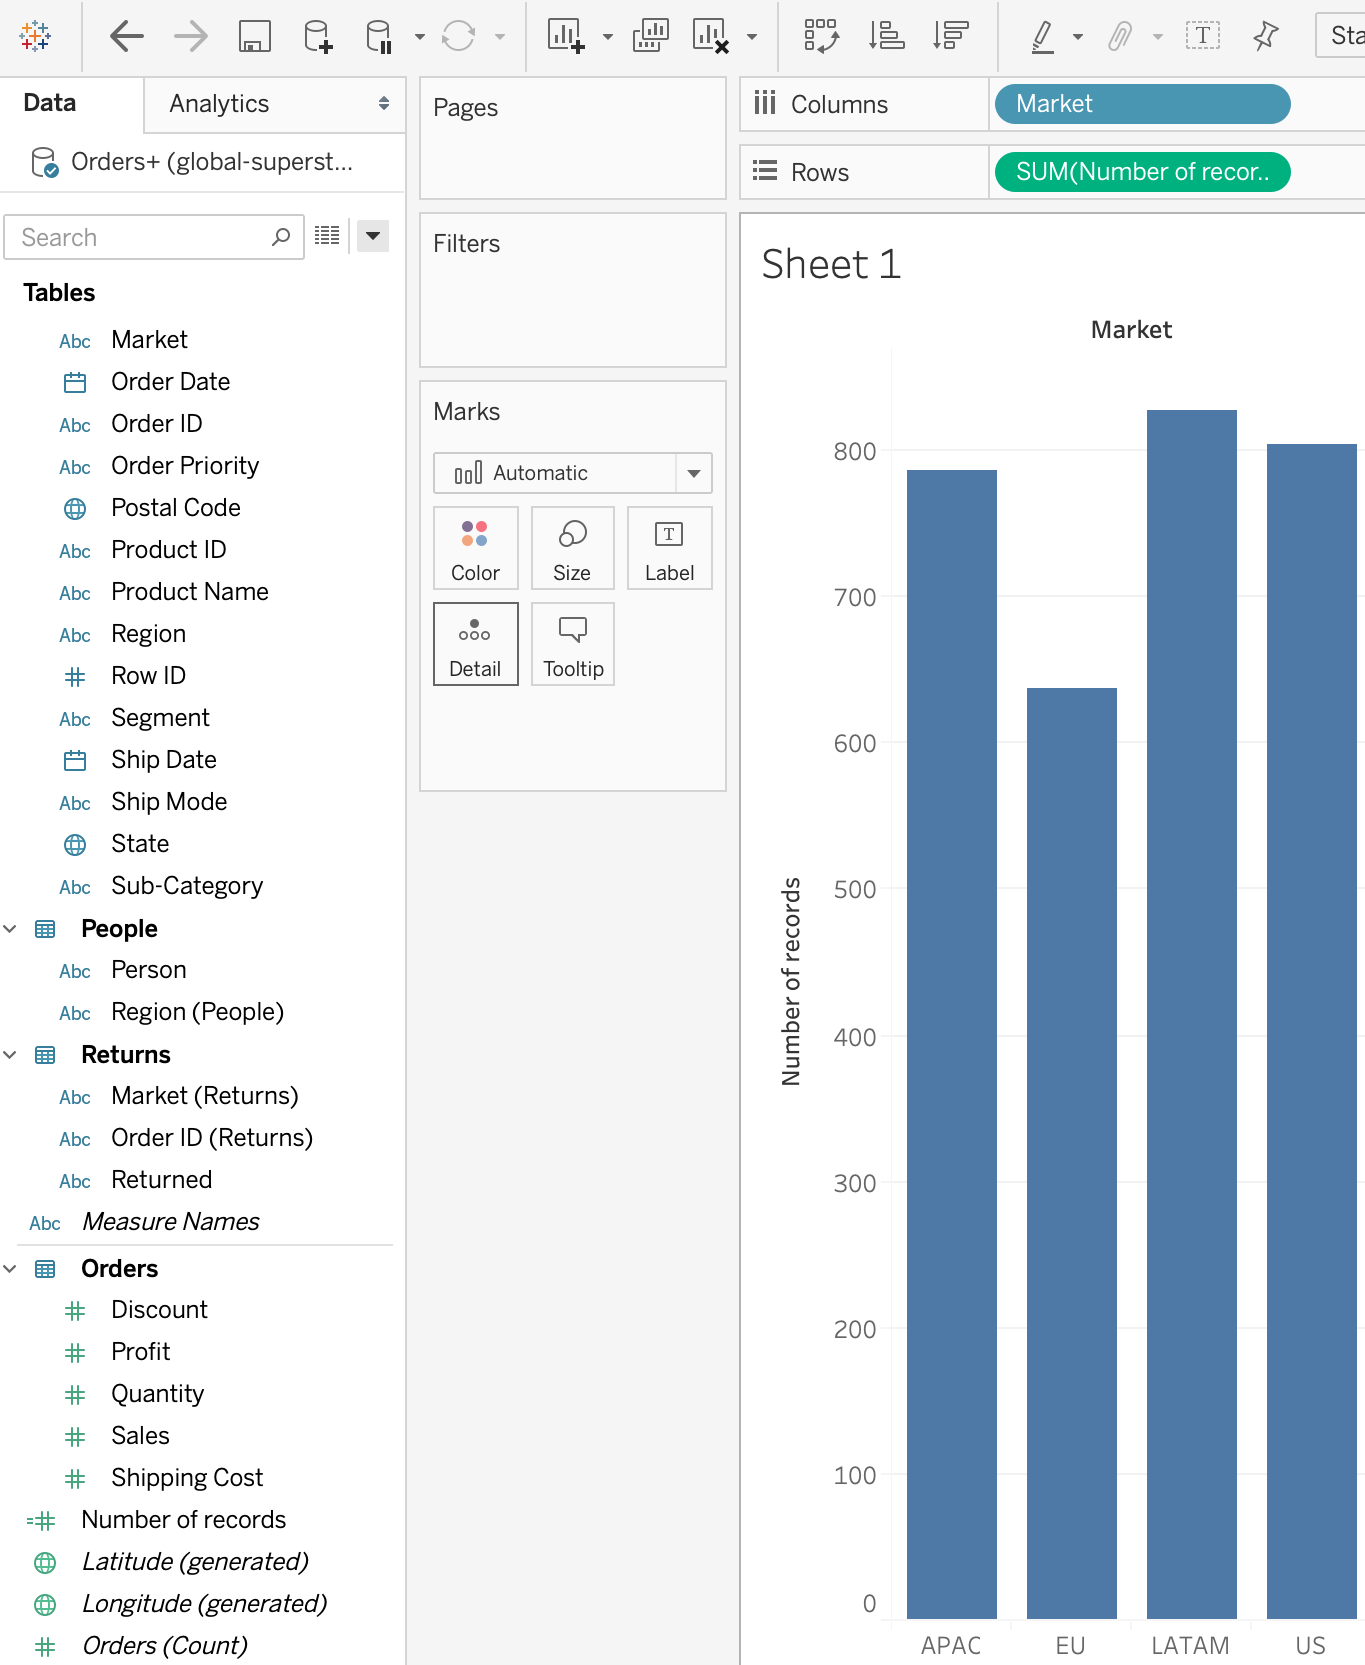
The reason for using 1 in step 3 is that each 1 is a representation one record in the data. So, when you drag it to the rows pane, the calculated field "Number of records" takes an aggregate form of the sum which gives us the total number of records for each market.
Secondly, You can also use Orders (Count) measure, which is the same as the Number of Records. However, instead of using sum (number of records), you need to use count as the aggregation for Orders(count).